2.2 - Linear Motion Graphs
Interpreting Graphs
| Graph | Meaning |
|---|---|
| Displacement–time | Gradient gives velocity. A horizontal line indicates rest; a straight sloping line indicates uniform velocity; a curve with increasing gradient indicates increasing velocity. |
| Velocity–time | Gradient gives acceleration; area between the graph and time axis gives displacement with its direction. A horizontal line indicates uniform velocity; a straight sloping line indicates uniform acceleration. |
| Acceleration–time | A line on the time axis indicates zero acceleration; a horizontal line above it indicates uniform positive acceleration; an upward-sloping line indicates increasing acceleration. |
Displacement–Time Analysis
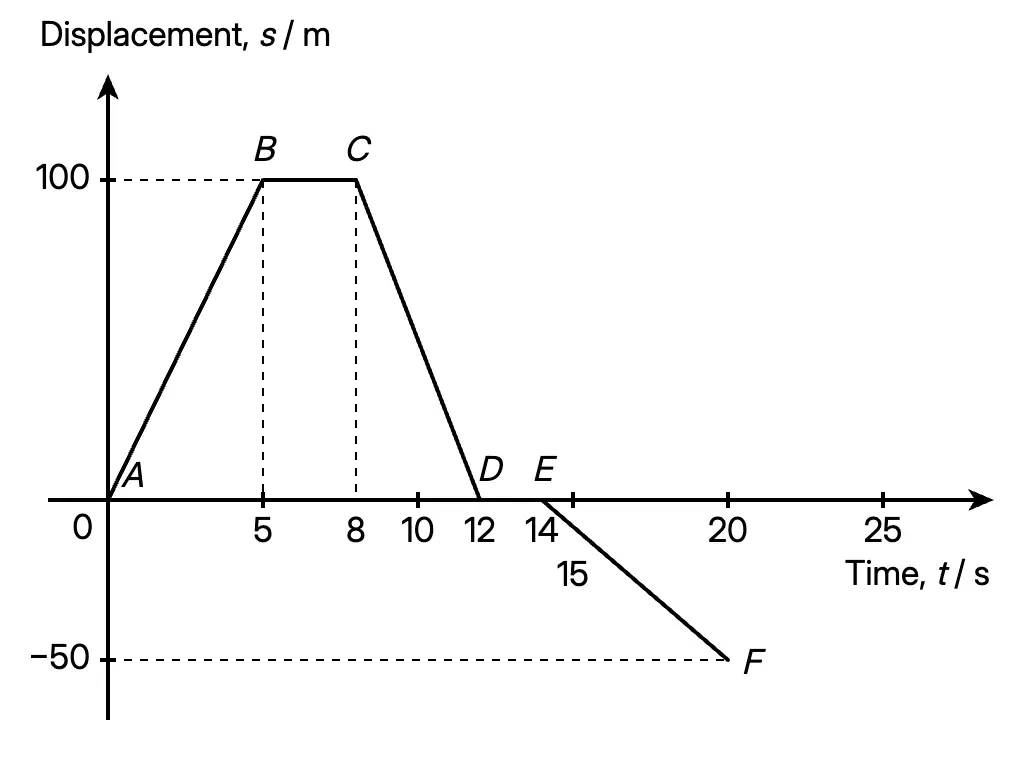
Taking motion to the right as positive, a motorcycle:
- 0–5 s: moves from to ; .
- 5–8 s: stays at ; .
- 8–12 s: returns to ; .
- 12–14 s: rests at the original point; .
- 14–20 s: moves to ; .
Total distance ; total displacement .
The negative velocities indicate motion to the left.
Velocity–Time Analysis
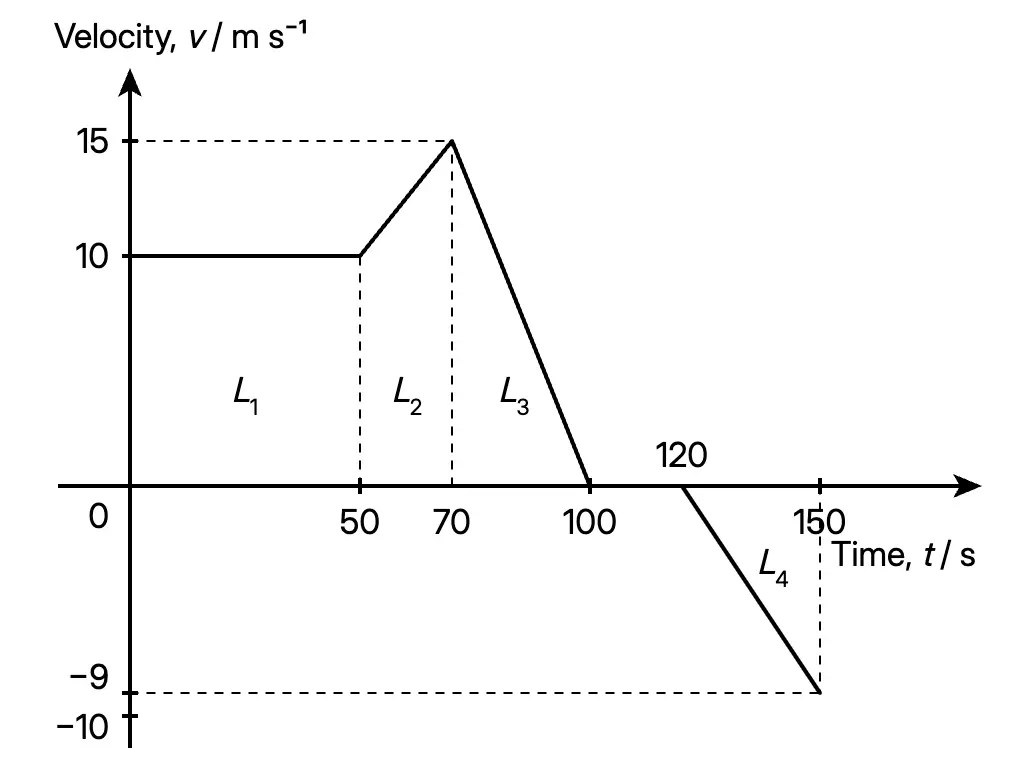
For a bicycle with motion to the right taken as positive:
- 0–50 s: ; .
- 50–70 s: rises from 10 to 15 ; .
- 70–100 s: falls from 15 to 0; . The bicycle slows while moving right.
- 100–120 s: ; the bicycle rests.
- 120–150 s: changes from 0 to ; . Its speed increases as it moves left.
- Areas above the time axis are 500 m, 250 m and 225 m; the area below has magnitude 135 m.
- Distance is the sum of the area magnitudes: .
- Displacement uses signed areas: to the right.
Converting between Graphs
- Video analysis with Tracker can represent motion using displacement–time, velocity–time and acceleration–time graphs.
- Convert displacement–time to velocity–time by finding each segment’s gradient. Convert velocity–time to acceleration–time in the same way.
- Determine displacement from the area under a velocity–time graph; divide a complex area into rectangles, triangles or trapeziums.
- Displacement example: displacement rises from 0 to 6 m in 0–6 s, stays at 6 m in 6–12 s, then rises to 10 m in 12–20 s. The corresponding velocities are 1, 0 and 0.5 .
- Kassim’s car: moves at 30 for 6 s, then slows uniformly to rest at 10 s.
- Displacements: and ; total 240 m.
- Accelerations: 0 and .
- Its displacement–time graph is initially straight, then curves with decreasing gradient to zero at 10 s.
Further Graph Examples
- Hasri accelerates from 0 to 6 during 0–3 s, maintains that velocity during 3–6 s, then slows uniformly to rest at 10 s.
- Accelerations: 2, 0 and .
- Displacement equals the trapezium area: .
- Average velocity .
- Three-stage car motion:
- 0–10 s: constant ; ; .
- 10–30 s: increases uniformly from 10 to 16 ; ; .
- 30–50 s: decreases uniformly from 16 to 0; ; .
- Cumulative displacement is 360 m at 30 s and 520 m at 50 s. The displacement–time graph is straight initially, then becomes steeper during acceleration and flattens during braking.
Answer practice questions to test your knowledge
Practice