Force and Motion
11.2 - Linear Motion Graphs
Linear motion is represented using displacement-time graphs and velocity-time graphs.
Displacement-Time Graph
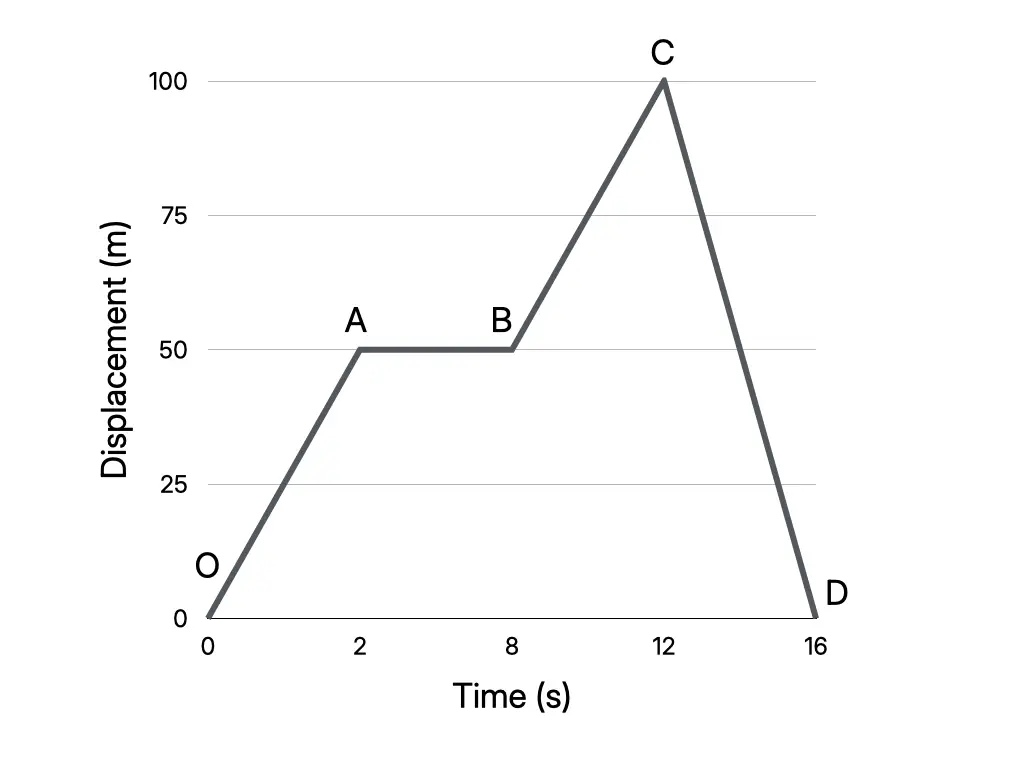
- Vertical axis: displacement, (m); horizontal axis: time, (s).
- The gradient gives velocity.
| Graph feature | Interpretation |
|---|---|
| Straight line with positive gradient | Uniform velocity in the positive direction |
| Steeper positive gradient | Greater uniform velocity |
| Horizontal line | Object is stationary; velocity is zero |
| Straight line with negative gradient | Uniform velocity in the opposite direction |
- Between and : .
Velocity-Time Graph
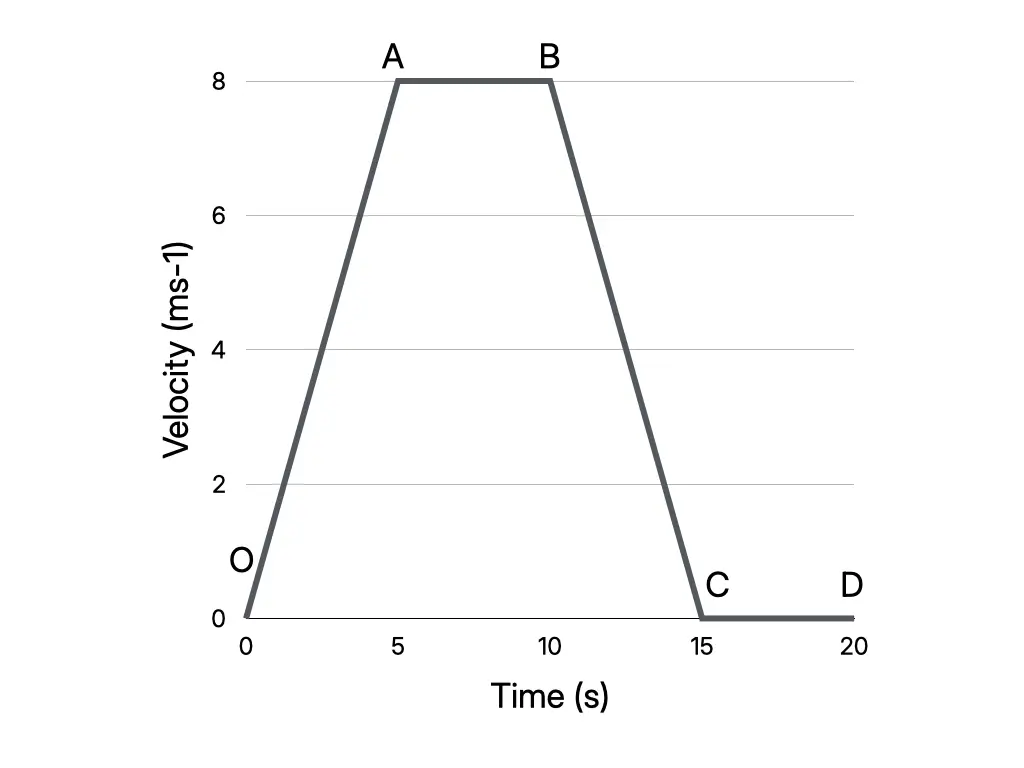
- Vertical axis: velocity, (); horizontal axis: time, (s).
- The gradient gives acceleration: .
- The area under the graph gives displacement.
| Graph feature | Interpretation |
|---|---|
| Straight line with positive gradient | Velocity increases uniformly; uniform acceleration |
| Horizontal line above the time axis | Constant velocity; zero acceleration |
| Straight line with negative gradient | Velocity decreases uniformly; uniform deceleration |
| Line on the time axis | Zero velocity; object is stationary |
For the motorcycle graph:
- OA: positive uniform gradient → velocity increases uniformly; uniform acceleration.
- AB: zero gradient → constant velocity; zero acceleration.
- BC: negative uniform gradient → velocity decreases uniformly; uniform deceleration.
- CD: line on the time axis → motorcycle is stationary; zero acceleration.
Numerical Problems from Motion Graphs
Displacement-time graph: read displacement from the vertical axis and calculate velocity from the gradient of the required section.
Velocity-time graph: read velocity from the vertical axis, calculate acceleration from the gradient and calculate displacement by adding the areas under the graph.
- Average velocity: .
- Rectangle:
- Triangle:
- Trapezium:
- Correct S.I. units: displacement in m, velocity in and acceleration in .
Activity 11.4: Drawing and Interpreting Graphs
Aim: Draw and interpret displacement-time and velocity-time graphs.
- Work in groups and select a coloured envelope prepared by the teacher.
- Discuss the situation in the selected envelope and draw its graph.
- Present the result to the class.
Answer practice questions to test your knowledge
Practice