1.2 - Scientific Investigation
Interpreting Graph Shapes
Graphs of investigation data show the relationship between two physical quantities.
| Shape of graph of against | Interpretation |
|---|---|
| Straight line through the origin with a positive gradient | is directly proportional to : , . |
| Straight line with a positive gradient, not through the origin | increases linearly with : . |
| Straight line with a negative gradient, not through the origin | decreases linearly with : , with . |
| Curve through the origin with a positive gradient | increases with . |
| Curve not through the origin with a negative gradient | decreases with . |
| Inverse-proportion curve with a negative gradient that does not intersect either axis | is inversely proportional to : . A graph of against is a straight line through the origin with a positive gradient. |
- A straight line that increases but does not pass through the origin indicates a linear increase rather than direct proportionality.
- For a straight line, gradient and -intercept give the equation .
Analysing Graphs
- Relationship: interpret the graph shape to describe how the two variables are related.
- Gradient: calculate and identify the physical quantity represented by the gradient.
- Area under the graph: use the relevant geometric area formula, including rectangle and triangle areas, to determine the physical quantity represented.
- Interpolation: read a value within the range of the graph; use a known to obtain , or a known to obtain .
- Extrapolation: extend the graph beyond the experimental data to predict the corresponding or value.
Force–Extension Graph of a Spring
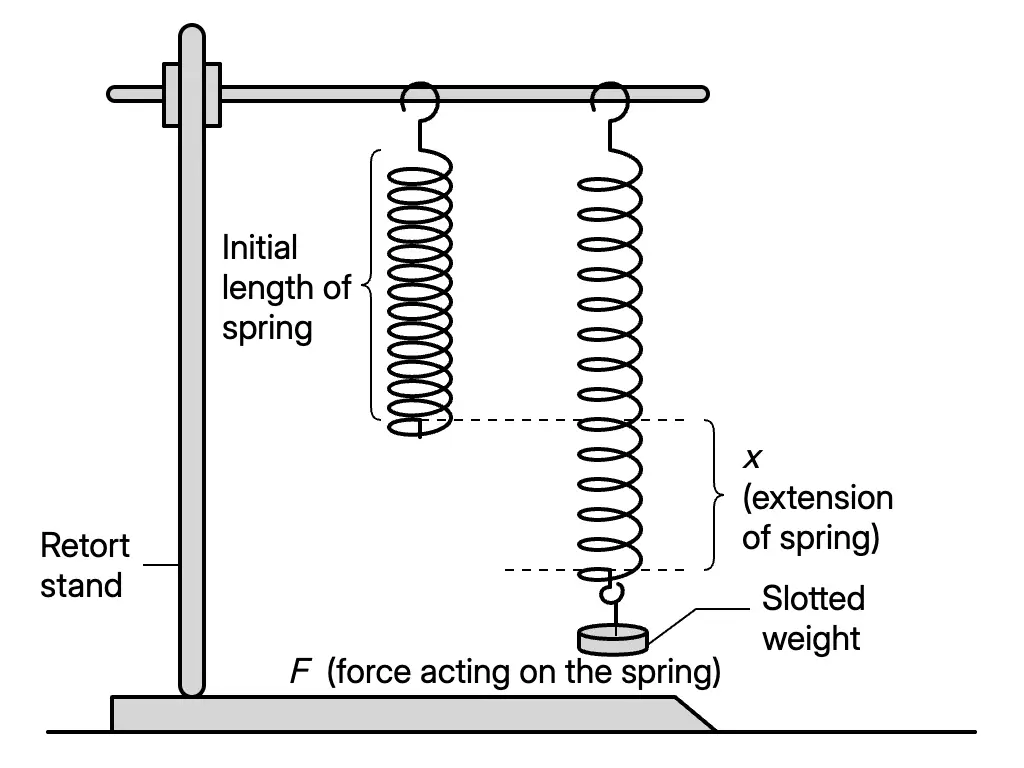
- Arrangement: a spring hangs from a retort stand with slotted weights attached. Extension, , is the increase from its initial length.
- The relationship is , where is force, is extension and is the spring constant.
- For a graph of against , the gradient represents .
- The area under the force–extension graph represents the work done in stretching the spring.
- The supplied data pairs, written as , are , , , , , , and .
Experiment: Length and Period of a Simple Pendulum
- Inference: the period of oscillation depends on the pendulum’s length.
- Hypothesis: a longer pendulum has a longer period of oscillation.
- Aim: investigate the relationship between pendulum length, , and period of oscillation, .
| Variable | Quantity |
|---|---|
| Manipulated | Length of pendulum, |
| Responding | Period of oscillation, |
| Constant | Mass of pendulum bob |
- Apparatus: retort stand, protractor, pendulum bob, stopwatch, metre rule and G-clamp.
- Materials: 100 cm thread and two small pieces of plywood.
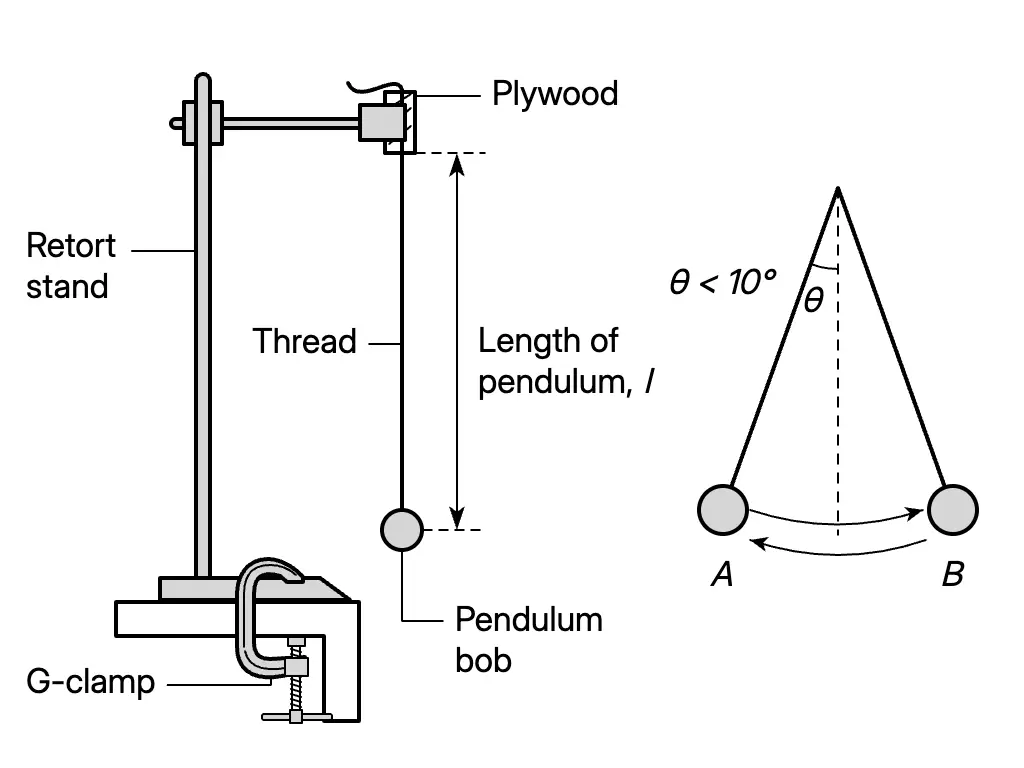
- Arrangement: suspend the bob by the thread from the retort stand, with the thread held between the plywood pieces. Secure the stand using the G-clamp. Pendulum length extends from the suspension point to the centre of the bob.
Pendulum Procedure and Results
Set up the pendulum apparatus and adjust to 20.0 cm.
Displace the bob by an angle less than from the vertical, then release it to oscillate.
Measure the time, , for 20 complete oscillations.
Repeat the timing and record .
Calculate the mean time and the period, then calculate :
Repeat the measurements and calculations for 30.0, 40.0, 50.0, 60.0 and 70.0 cm.
Record the results for each length, including both timings, their mean, and .
| Recorded or calculated quantity | Unit |
|---|---|
| Pendulum length, | cm |
| Time for 20 oscillations: , , | s |
| Period, | s |
| Square of period, |
Pendulum Analysis and Experimental Report
- Data analysis uses separate graphs of against and against to establish the shape and relationship in each case.
- The gradient, , of against is expressed in S.I. units. Here, is the Earth’s gravitational acceleration:
- Comparing with gives , hence . Use in metres to obtain in .
- The standard value for comparison is .
- A complete report records the inference, hypothesis, aim, variables, apparatus, materials, procedure, results, data analysis, conclusion and discussion.
- The conclusion follows from the measured results and the graph relationships.
Answer practice questions to test your knowledge
Practice